Nepal faces a high risk of landslides due to its mountainous terrain, monsoon rains, seismic activity, and underdeveloped infrastructure. In April 2015, Nepal experienced a devastating magnitude 7.8 Gorkha earthquake, resulting in the loss of over 9,000 lives and causing damages exceeding $1 billion. Because of this earthquake, the monsoon season brings about an additional threat of rainfall-triggered landslides. Previous research has attempted to assess and model landslide hazards using limited landslide event data. However, the scope and size of these databases are constrained by biases arising from unreported events in sparsely populated areas and the grouping of events with their primary triggers. It is crucial to develop an accurate landslide event inventory to address the current underestimation of landslide impacts. Conventional methods for detecting landslide events rely on manual interpretation of high-resolution imagery and digitization by analysts, which are labor-intensive and hindered by spatial and temporal limitations.

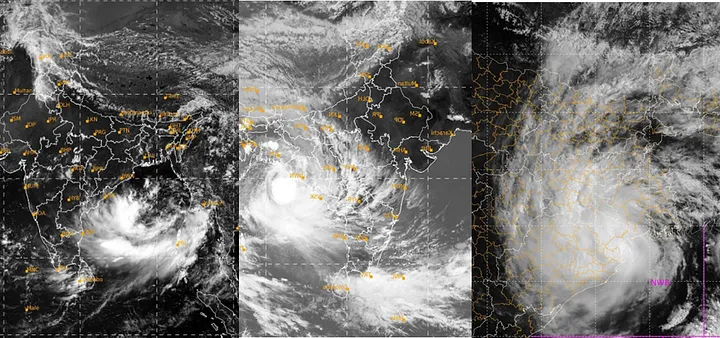
Firstly, you need to identify satellite images that show the area where the slide occurred. You will need two dates: one before the slide and one after. You can search for these images on Google or other sources. For this demonstration, I used JPEG images from the Set Gallery. You can download these images directly. Once downloaded, you will have two JPEG images.
To determine the location of these images, open ArcGIS Pro. Open the downloaded images in ArcGIS Pro to view the specific location. This will help you understand the area the images belong to. You can use the base map option in ArcGIS Pro to identify the location by selecting the Image Hybrid option. This will provide nearby location names, this place is located in close proximity to Chepeguan, Nepal. Search accordingly and note the location name.


Once you have confirmed the location, you can proceed to download the Landsat images of that specific area and date from the Earth Explorer website, which can be accessed through the following link: “https://earthexplorer.usgs.gov/”. Additionally, you have the option to acquire high-resolution Maxar images using Esri’s Way back Imagery feature. This will enable you to access detailed imagery of the location from various time periods.
To download the satellite image, log in to Arc Explorer using your ID and password. Once logged in, you can use the address and place options to search for the location you previously identified. The advantage of this option is that it will automatically cover the nearby area when downloading the Landsat image. Choose the desired date range for the Landsat image.

Out of the available options, I have downloaded the images for two specific dates: November 21, 2014, and December 4, 2013. However, for the initial analysis, I have chosen to focus on the image from November 21, 2014.
After downloading the images, there are two techniques to extract the slide area: single image analysis and multi-date image analysis.
First, Open ArcGIS pro then I will select the add data and select mtl.txt file of the downloaded satellite image.


To extract information from the single image, you can subset the material by using the clip tool. This will create a clipped image of the desired area. Further analysis and processing can be done on this clipped image.


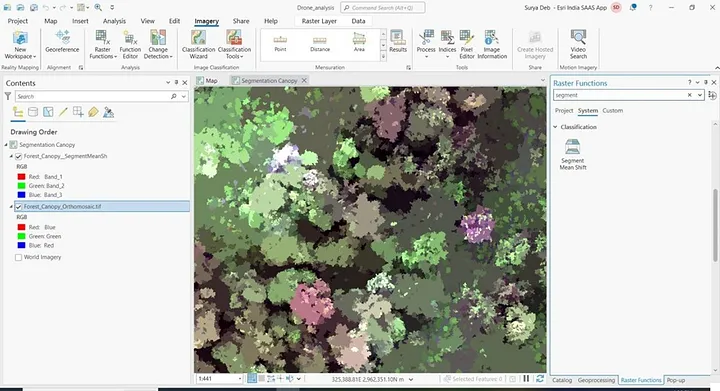
To extract the slide area, we can now apply indices to the selected clip image. To begin, navigate to the “Imagery” section and proceed to the “Indices” tab. Instead of using NDBI (Normalized Difference Built-Up Index) typically employed for identifying buildings, our focus here is on extracting the slide area. For this purpose, we require the SWIR (Short-Wave Infrared) and NIR (Near-Infrared) bands. Thus, we will utilize the direct tool, NDBI, to facilitate the extraction of the slide area efficiently.
To calculate the area of the slide, you can apply indices to the single image. Select the shorter wave Infrared band and the infrared one band for the calculation. One suitable index is the Normalized Difference Built-up Index (NDBI), which is sensitive to sand particles. This index will highlight the target area.
To automate the process, you can use the available indices in the imagery toolbox. Select the NDBI index and apply it to the Landsat image. This will highlight the slide area.


Next, you can proceed with classification. Using the ISO Cluster and supervised classification techniques in the analysis toolbox, you can classify the highlighted area and extract the slide area.
These are the steps involved in identifying a slide area using satellite imagery and remote sensing techniques.
To perform an ISO Cluster Unsupervised classification technique, follow these steps:
Open the analysis tab and navigate to the tools section.
Within the tools section, locate the ISO Cluster Unsupervised classification technique, which is used for analyzing data.
Choose the desired image and specify the indices clip image for the designated slide area.
Set the number of classes to 4, indicating the desired classification groups.
Finally, execute the ISO Cluster Unsupervised classification technique to initiate the analysis process


To enhance the slide area, we will perform a reclassification of the image into two classes: slide area and non-slide area. This process aims to differentiate and highlight the specific region of interest on the slide.
To perform re classify need to go to analysis tab then select tool and under favorite search re classify
Select the unsupervised clip image as the input data.
In the new value section, update all values of 1, 2, and 3 to 1. This step is aimed at grouping these values together.
Keep the target value, which is 4, unchanged as the default. It will remain distinct from the other values.
By making these adjustments, the input data will be altered to consolidate the values 1, 2, and 3 into a single category while preserving the target value of 4.


Then after running the model, you will get all polygon. Then selected the slide area polygon and extract as a new layer.

Now calculate the area in attribute table

Final output of slide area
Multidate imagery processing
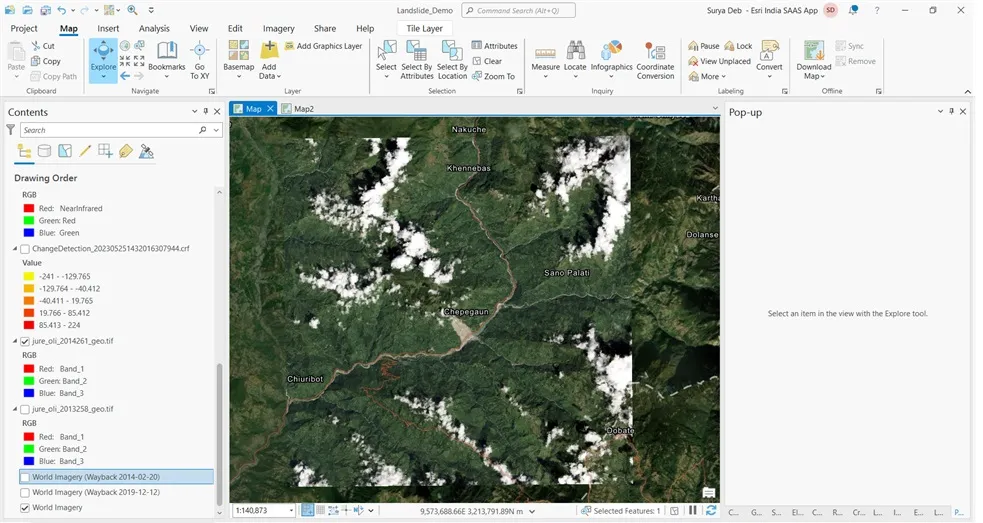
Now we will move on to the multidate imagery processing for landslide identification. Click on the “Clip” option to select the area you want to focus on. This will create a clipped image of the area after the slide occurred. Similarly, clip the area before the slide to create another image


For multi-date analysis, there is a useful tool called the Change Detection Wizard. Select the “Before” image and the “After” image in the wizard. Choose the “Pixel Value Change” option to analyze the differences between the two images. You can select the “Absolute” or “Relative” difference type, and for band differences, choose the indices technique. In this case, we will use the Normalized Difference Built-up Index (NDBI) by selecting the shorter wave Infrared band and the near-infrared band.


After setting the parameters, click “Next” and check off the “Classify Difference Value” option. Proceed with the next steps and run the analysis. The resulting image will show the changes that occurred after the slide. You can further enhance the image to highlight the slide area.

The advantage of using multi-date images is that they clearly show the changes over time. The unchanged areas will appear similar, while the slide area will stand out. Adjust the visualization settings as needed to emphasize the slide area.

The Change Direction tools in ArcGIS Pro are powerful and useful for extracting specific changes in pixel maps. They work well with multi-date images and the indices technique. This approach provides more accurate results compared to single-band analysis.
By following these steps and using the Change Detection Wizard, you can effectively identify and analyze slide areas using satellite imagery.
Video link
Thank you.