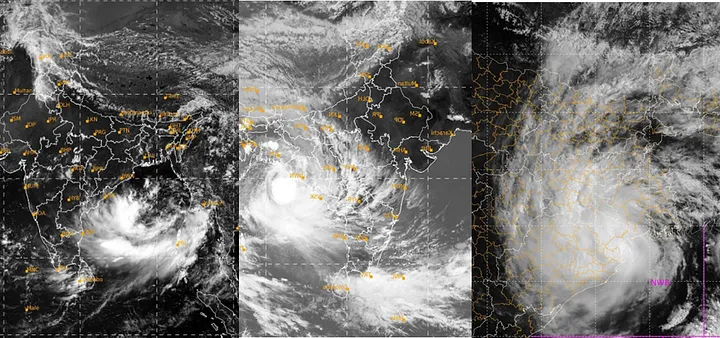
In May 2021, Cyclone Yaas hit the east coast of India with wind gusts up to 140 kilometers per hour (87 mph). It strengthened to the equivalent of a Category 1 Atlantic hurricane on May 23 and made landfall at Balshwar on May 25 at peak intensity. The storm produced damaging storm surges, which caused flooding and left tens of thousands of people homeless.

Synthetic Aperture Radar (SAR) data is particularly useful during weather emergencies like cyclones and hurricanes because it can see through cloud cover that often hampers other sensors’ abilities to capture the situation on the ground. After SAR data is captured, it must be processed and analyzed.
The following flood analysis from Cyclone Yaas was performed using ENVI® SARscape® by our exclusive Indian distributor, Esri India. ENVI SARscape is the leading SAR processing and analysis software on the market and is used worldwide to extract actionable information from SAR data. To perform the analysis, Sentinel-1 data captured before and after the cyclone (May 17 and May 29) and ENVI SARscape was used to create a SAR composite image. Next, the flooded area was extracted, and a change detection analysis was performed. Below are more details on these steps.

1. Software used.
ENVI Sarscape, ENVI Sarscape Analytics, ArcPro
2. Methodology
Here I processed the data to create 3 different data sets
· SAR composite image creation using SARSCAPE.
· Flooded area extraction Using SARSCAPE analytics.
· Change detection analysis using SARSCPE analytics.
Extraction of Flooded layer using Multispectral data in ArcPRO
SAR composite image creation using SARSCAPE
After downloading the images pre-processing are done in ENVI SARSCAPE, ENVI SAR SCAPE ANALYTICS and in ArcGIS Pro software. After downloading the images of before and after cyclone this (mainfest.safe) image file of both images are imported using ENVI SARSCAPE. After importing the images, we need to process filtering to improve the quality of that image. In this step, you will apply a spatial filter to the subset intensity images to reduce the speckled appearance. You will use a mean filter, which replaces each pixel with the mean value of its surrounding pixels in a 5x 5 pixel moving window. And for that we selected that imported file(.pwr) process single image filtering over it. After filtering image quality improved smoother appearance, compared to the original images. Now next step we did that was geocoding or geometric and radiometric calibration of the filtered intensity images. These steps are important if you will be comparing multiple intensity images over time. SAR systems measure the ratio between the power of the pulse transmitted and that of the echo received. This ratio (so-called backscatter) is projected into the slant range geometry. Geometric and radiometric calibration of the backscatter values are necessary for inter-comparison of radar images acquired with different sensors, or even of images obtained by the same sensor if acquired in different modes or processed with different processors. But before doing geocoding we need to download Dem of that area and process it in sarscape supported format (.bill). After converting that file now, we used that processed dem file in geocoding process otherwise direct option is their to down load Dem data for full study area inside geocoding steps under sarscape. After geo coding image perfectly seating over base map. Now next step we did that was create colour composite. A common task in SAR analysis is to create a colour composite image from different polarizations. This can help to visually distinguish between different surface features such as mountains, cities, and water bodies. In this section, we created a colour composite of the geocoded metaspectral dataset using the following polarization combination and those are VV(Red), VH(Green) and VV/VH ratio (Blue). All this process applied in both before and after flood images.


Flooded area extraction Using SARSCAPE analytics
SARSCAPE ANALYTICS is very easy tool to extract flooded are directly giving input pre and post sar images. But you have to download same area covered sar scene to processed it in sarscape analytics. Here in post event you have to give after cyclone SAR data and pre-event you have to give before cyclone image (manifest.safe file). Dem option I used Extract SRTM -3 V4 DEM. Output coordinate system I used UTM-GLOBAL, NORTH, UTM Zone 45, WGS 84 according to Bengal Odisha. Now you must give grid size 15m. Now save your data in your targeted output folder. Now Deleted imported and sample data, Deleted processing data and Deleted working files all select No and run the output. After that you will get all the layers in your target folder which included the flooded layer, which I did refinement to improve identification of Flooded area.


Change detection analysis using SARSCPE analytics.
Change detection analysis is mainly easy process to classified SAR images according to their changes after flood situation. Here in post event, you must give after cyclone SAR data and pre-event you have to give before cyclone image (manifest.safe file). Dem option I used Extract SRTM -3 V4 DEM. Output coordinate system I used UTM-GLOBAL, NORTH, UTM Zone 45, WGS 84 according to Bengal Odisha. Now you must give grid size 15m. Now save your data in your targeted output folder. Now Deleted imported and sample data, Deleted processing data and Deleted working files all select No and run the output. After that we can get classified output of SAR data.


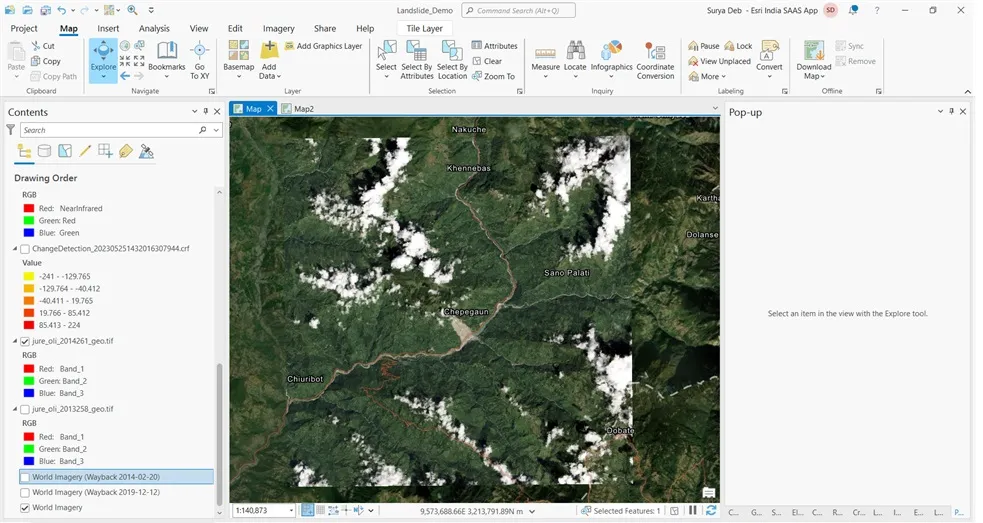
Extraction of Flooded layer using Multispectral data in ArcPRO
To extracted flooded layer from multispectral imagery I used Landsat 8 image before and after cyclone. First step which I did over Multispectral data simple calculate MNDWI over before and after cyclone as in arpro we have direct option to calculate MNDWI.


After extracted MNDWI we classified this image in 4 group using un-supervise classification technique using spatial analysis tool-> Multivarate->ISO Cluster unsupervised classification


After that we need to reclassify this data in 2 group one will be water and another will be non-water using reclassified tool under spatial analysis. For that we converted all value in group 1 as a non water and water as 4.

After this step we need to covert this raster date in polygon format. To extracted flooded area we need to run spatial query as converted polygon has 2 value in attribute table 1 and 4. So here 4 will be the water.

After this step you can extracted the flooded area. For that you required minimum editing over that data to get good results.


In conclusion, SAR imagery demonstrates superior accuracy compared to multispectral data. SAR data is particularly advantageous as it allows analysis even in cloudy conditions, which may not be suitable for multispectral data. This tutorial aimed to provide insights into both processes, highlighting that the choice of process should be based on data availability and specific project requirements.